This is now our third annual update of LMS market share data for higher education institutions in the US. (We’ll also update some global numbers below.) At a high level over the past year, we saw:
- Healthy movement of schools among different LMS products as switching costs continue to decrease;
- Changes in vendor hosting patterns: while the two most popular LMS configurations continue to be self-hosted, proprietary and vendor-hosted, proprietary, the fastest-growing is vendor-hosted, open source;
- A stronger commitment by schools to maintain and update their LMSs to more-current versions;
- A continued consolidation onto these 6 major LMS platforms: Blackboard Learn, D2L Brightspace, Instructure Canvas, Moodle, Pearson’s Learning Studio, and Sakai; and, related
- Fewer schools appear to be using “other” LMSs though usage of “other” LMSs continues to be more-highly associated with smaller school sizes.
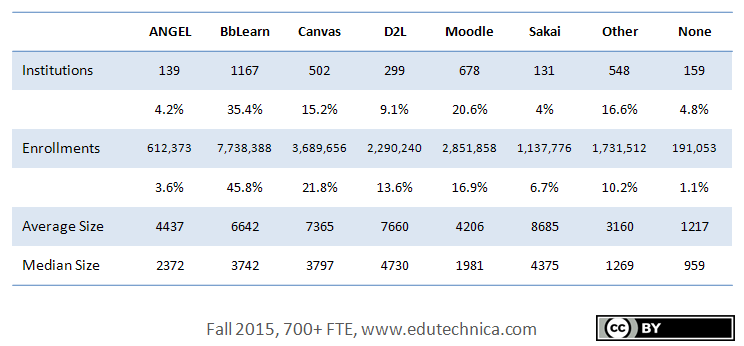
This year’s US data includes all schools with greater than 700 FTE students as determined by the US Department of Education’s IPEDS data source. If an individual institution, as listed in this data source, is known to use a particular LMS, this is reflected in the graphic below. A single institution can use more than one LMS, which is why the percentages add up to over 100. (Some institutions for whatever reason host multiples of the same LMS – these only count once.)
Some LMS-specific highlights include:
ANGEL
- A quickening pace of institutions moving away from ANGEL, which reaches its end-of-life in October 2016. This product is now clearly experiencing a steady decline.
Blackboard Learn
- While it is encouraging that two-thirds of Blackboard Learn installations are now on the 2014 releases (there is not a 2015 release available yet at the time of this writing), an estimated 10.5% of Blackboard Learn customers currently run unsupported versions. This is expected to soon rise to as high as 19.9% in December 2015 when 9.1 SP14 falls into unsupported status.
- At the time of our data compilation, no Blackboard Learn installations in this data set were known to be using the new SaaS/Ultra configuration.
D2L Brightspace
- The D2L organization has now moved roughly one-fifth of its US customer base to its continuous delivery version with automatic monthly updates; however the vast majority of those running this new version are institutions who host with the vendor.
Instructure Canvas
- Canvas continues to experience significant uptake at a pace of around 2 new higher education institutions per week on average.
- New Canvas institutions have come from almost all other flavors of LMSs, but it is not always guaranteed that Canvas is selected following a pilot or evaluation.
- Update: Due to the questions we’ve received about Canvas, it’s important to remember our original methodology. The number of all Canvas environments reflects the total that could be materially connected back to a university and does include known pilot installations. Historical trends show a high correlation between piloting Canvas and switching to Canvas. We QA our data set with each post and remove both pilot and legacy LMSs when they are no longer in use.
Moodle
- Moodle continues to be an extremely popular LMS choice, and there are no indications that this will soon change.
- To Blackboard’s credit, the organization continues its commitment to keeping its Moodlerooms Joule customers up-to-date. Blackboard became the single largest source of institutions running Moodle 2.8 during the past quarter. (Update: We previously incorrectly listed these installations as version 2.9 due to a scripting error.)
- Additional Moodle hosting organizations appear to be gaining traction by successfully competing with the incumbents.
Sakai
- Of the remaining Sakai institutions, a larger number have been staying up-to-date on more-recent versions of Sakai.
- Though institutions are still switching from other LMS solutions to Sakai, Sakai’s institution-base continues to show signs of overall weakening with more than one-quarter of remaining institutions exploring or actively running an alternate LMS.
An interesting challenge for us during the past year has been how to account for those institutions who are ceasing operations due to financial pressure, or as is the case with Corinthian, government intervention. Some of these schools, for example Heald, have web sites that no longer load and phone numbers that ring busy, but their zombie LMSs live on. Can students still log into and retrieve materials from these LMSs? We don’t know. In cases where these LMSs still exist, we include them in this report. Pearson’s Learning Studio, because of this organization’s higher concentration of for-profit universities as customers, is disproportionately impacted.
Trends
To make a fair comparison of how this data set has changed over the past 3 years, we consider only the data available for the same set of schools greater than 2000 FTE in size available for each year of our collection. (See the 2014 yearly update for more details on how to compare the 2014 and 2013 data.)
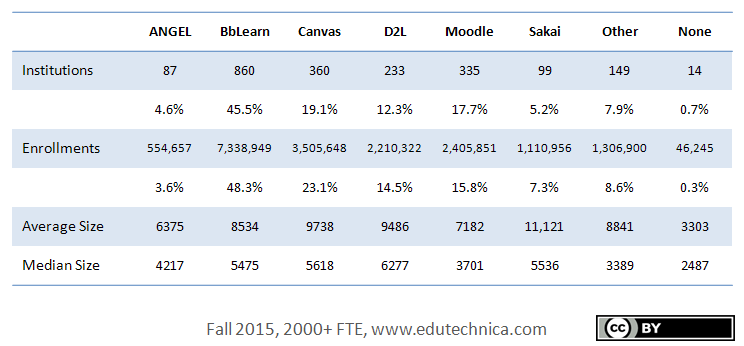
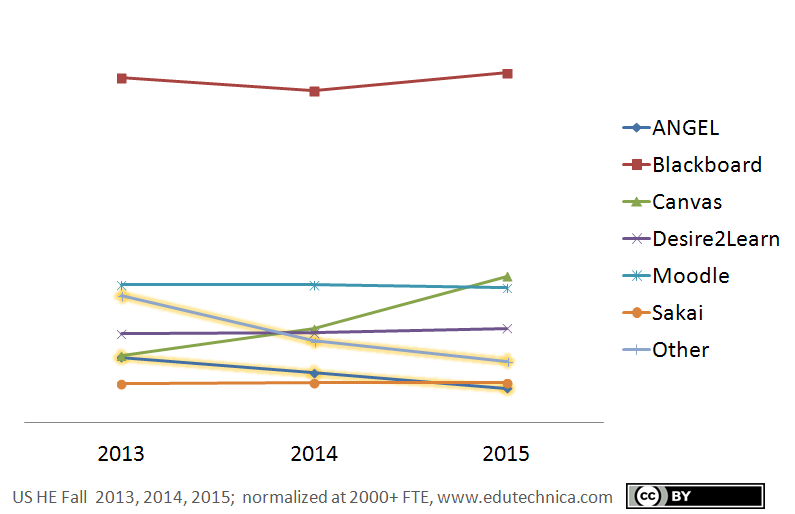
When doing so, one can make the following observations about US higher education institutions of 2000+ FTE in size:
- Usage of Blackboard Learn, though down in 2014, has returned to its 2013 level driven primarily by conversion of schools previously using ANGEL.
- There are significant decreases in schools of this size using ANGEL and “other” LMSs. (“Other” LMSs have often been used in tandem with another LMS, so there is not always a +1 gain elsewhere when an “other” LMS is decommissioned.)
- Moodle at this size level is down slightly while D2L Brightspace is up slightly.
- Canvas has experienced significant growth and has overtaken Moodle in market share when considering only schools of this size – in effect taking second place to Blackboard Learn earlier in 2015.
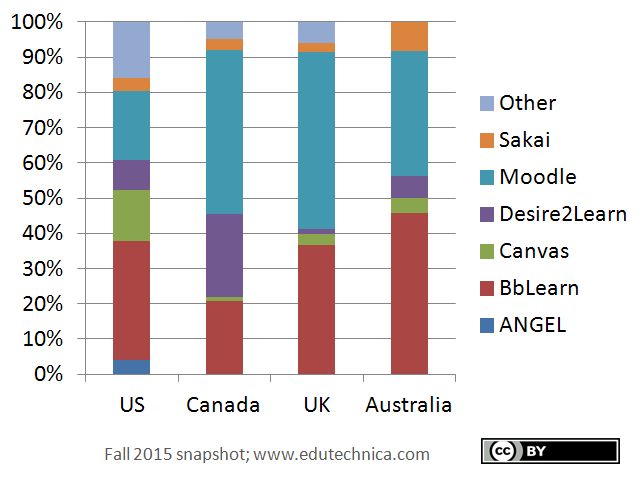
Despite its US growth, Canvas, has not yet experienced significant growth globally, at least at the university level. The next chart shows LMS usage only for higher educational institutions officially recognized by their respective federal departments of education as “universities” however defined by local laws and regulations as linked below.
Blackboard Learn and Moodle continue to dominate LMS usage for universities across the US, Canada, UK, and Australia. In Canada, D2L’s Brightspace takes second place behind Moodle and above Blackboard.
For additional information, please visit this site. Edutechnica thanks Client Stat for their continued support of this project.
