Two months ago, we launched MOOC Map, a chronological, interactive map showing the growth of the major xMOOC platforms. It was our first attempt at using data and visualization to better understand the adoption of educational technology. It received mild traction in the press but well over 100,000 visitors during its first month of publication.
Since then we’ve been busy working on our next project. In 1990, The Campus Computing Project began helping higher education institutions to better understand educational technology trends (and not just those relating to LMSs or MOOCs). However, most of the data collected for this project, as the name suggests, comes from a survey. We wanted to see if we could build an automated way to generate a more complete data set around just the LMS usage component of this survey.
Using open data sets from the US Department of Education National Center for Education Statistics, the UK Higher Education Statistics Agency, Statistics Canada, the Association of Universities and Colleges of Canada, and the Australian Open Data site, we created a dataset of all universities in the United States, Canada, the United Kingdom, and Australia including their enrollment numbers, geographical coordinates, and URLs. We then used a combination of Google’s search API, Microsoft’s Bing search API, and a number of open source software libraries to crawl each university’s web site to identify the primary LMS (or in more than 200 cases, multiple primary LMSs) in use. After verification and removal of LMSs that were not in production use or used only by a single instructor or department, then categorizing those that could not be identified, we aggregated and correlated the data. The data set for institutions with greater than 2000 enrollments in the US is 99% complete (some institutions, predominantly those focusing on the arts or trades, did not appear to utilize an LMS). Similarly, the datasets for Canada, the UK, and Australia are both 100% complete.
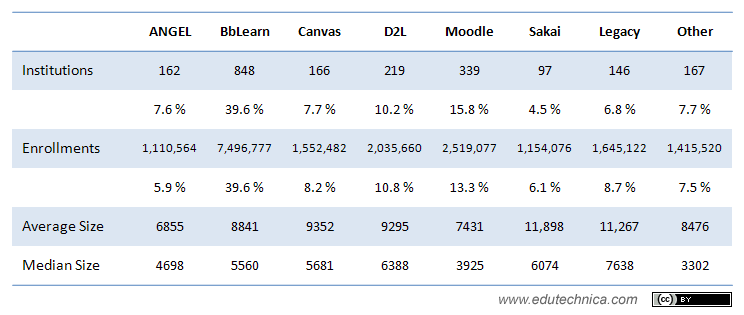
Our approach looked at each institution individually and searched for its LMS(s). Therefore there is a 1:n mapping of institutions to LMSs (ie: each institution is guaranteed to have at least one LMS; some institutions will belong to more than one category below). For consortia sharing a single LMS instance, each member institution was tagged as using that type of LMS. The category of “legacy” seen in the table below includes Blackboard versions prior to 9.0 including Blackboard Academic Suite and the former WebCT line of products. The “other” category includes various LMSs including Learning Studio/eCollege, Jenzabar’s e-Racer, SharePoint, WebStudy, OpenClass, Scholar360/Edvance, other commercial LMSs, other open source LMSs, and LMSs developed in-house.
Most of our effort was spent focusing on collecting data for US institutions. For most of the major LMSs we were able to extract the LMS version, whether the LMS environment was hosted by the institution or vendor, and in some cases even which add-ons and plugins were installed in the LMS (we hope to provide these details in a subsequent post). We were also able to complete an analysis of global LMS usage for institutions in the US, Canada, UK, and Australia.

Comparing LMS usage by country, we began to see some interesting differences.

We hope that this post generates some interesting conversation at the EDUCAUSE Annual Conference being held this week. In future posts, we hope to provide further interesting insights into educational technology usage and trends.