Monthly Archives: September 2014

LMS Data – The First Year Update

It has been one year since the edutechnica team has been tracking and trending global LMS usage. Over the past year we’ve been quite busy refining our methodology and ensuring quality of this data. Without further ado, we present to you our 2014 LMS usage data ahead of the 2014 EDUCAUSE annual conference.

To begin, let’s review the 2013 data set encompassing all US higher education institutions with greater than 2000 FTE.
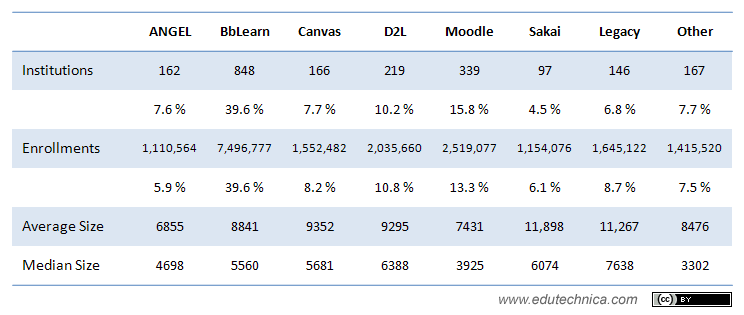
Detailed 2013 LMS usage data for higher education institutions with > 2000 enrollments (United States)

For 2014, here is that same set of data for all US higher education institutions, again with greater than 2000 FTE. You’ll notice some differences in the next graphic below. Some schools during the past year have chosen to use multiple LMSs. Others have consolidated onto one. Some have merely switched flavors. Still others have chosen to move from having no LMS to one LMS. A lagging minority have finally migrated from what we termed in 2013 a “legacy” LMS to a modern one. Our data, again, reflects active LMSs in use by a given institution, excepting those that are clearly used for only a specific course or by a specific instructor. When an LMS is used by the “distance education program” or by an entire college, we include it in these calculations.

This year, we also break out institutions who do not use an LMS separately (these, again, tend to be performing arts schools, beauty and massage therapy schools, trade schools, automotive repair schools, driving schools, and others that offer programs of study with significant face-to-face or hands-on components).

In 2013, the denominator of our market share calculation was the total number of LMSs in use. We have changed the denominator of our calculations in 2014 to be the number of institutions with greater than n FTE to reflect a more accurate calculation of market share. To do a direct year-over-year comparison from the 2013 data, it is best to view the row labeled “2013 method” in the graphic below; however, we will use the “2014 method” moving forward for a more accurate measurement.
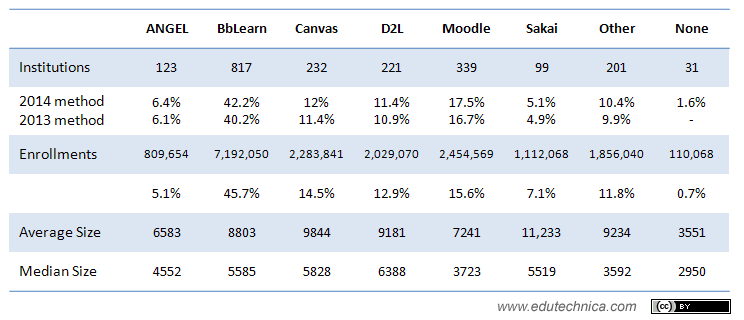
Detailed 2014 LMS usage data for higher education institutions with > 2000 enrollments (United States)

During 2014 we became better at collecting data for smaller institutions. In February, we released analysis for US institutions with greater than 1000 FTE. Today, we provide the same data for all institutions with greater than 800 FTE.

As you can see, the data that encompasses smaller institutions tells a very different and more complete story that reflects a truer representation of LMS usage. The most notable differences here are that when including smaller institutions, market share of Blackboard Learn by number of institutions drops significantly while Moodle and “Other”gain significantly. In 2014, it still holds true that smaller institutions are more likely to use a non-traditional LMS or Moodle.
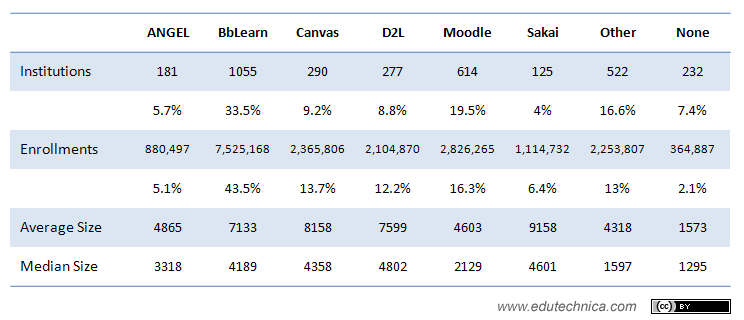
Detailed 2014 LMS usage data for higher education institutions with > 800 enrollments (United States)

In addition to our analysis of US higher education, we again analyzed LMS usage in Australia, Canada, and the UK for a more global perspective. For our 2014 analysis, we used the same set of institutions that we used in 2013 to keep this data uniform. Combined with the US data, you can see how total global LMS usage in these four countries compared from 2013 to 2014 in the two graphics below. Moodle, Canvas, and “Other” take a larger piece of the pie. ANGEL and Blackboard Learn shrink in comparison. Desire2Learn and Sakai remain relatively constant.
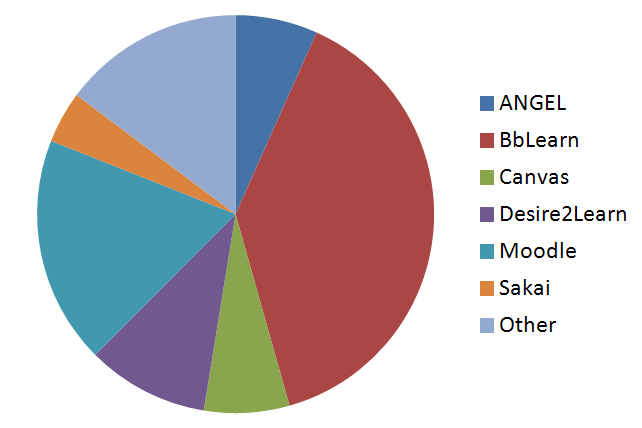
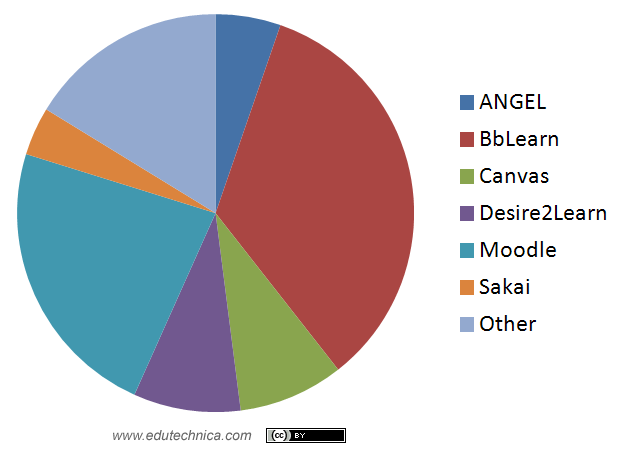
2013 LMS usage for HE institutions in US, Canada, UK, and Australia
2014 LMS usage for HE institutions in US, Canada, UK, and Australia

As for global LMS usage, we also offer the same 2013/2014 comparison  of LMS usage by country as percentage of total in the two graphics below.

2013 HE LMS usage by geography as percentage of total

In 2014, ANGEL usage shrinks in all countries, and Moodle usage grows in all countries. Blackboard Learn has shrunk the most in the UK. Canvas has not taken off overseas in the same way that it has in the US. Usage of Other LMSs has grown in the US and in Australia but has shrunk in Canada and the UK.
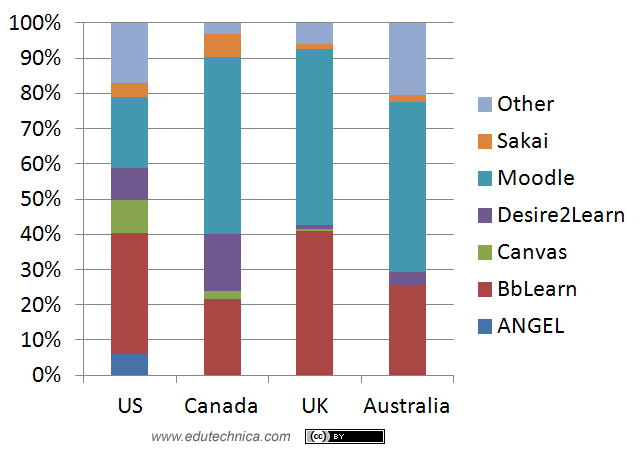
2014 HE LMS usage by geography as percentage of total

Addendum

Allan Christie, currently the General Manager of Blackboard Australia and New Zealand, points out on his blog some helpful information to better understand the Australian higher education market. In summary, Australia “generally accepts” that there are only 39 big U universities while there are 176 “registered higher education providers.” When considering only the universities, the above global LMS usage chart would look like the one below. This modification puts Blackboard Learn squarely in the lead in Australia and at the highest percentage market share of any other country presented.
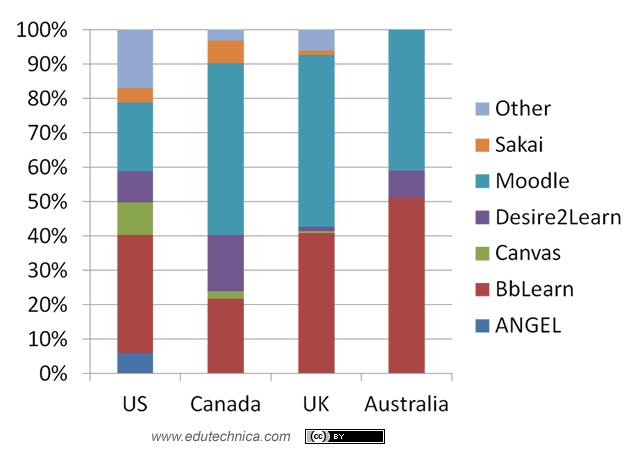
2014 HE LMS usage by geography as percentage of total (Australian universities only)

Similarly, our UK data includes many more institutions than are categorized as universities by the Universities UK organization including Colleges of higher education and Further Education colleges. We assume the same may be true in Canada. In the US, however, we use the US Department of Education’s Integrated Post-secondary Education Data System as our source of truth for a complete list of institutions.

We would like to know more about how to better provide accurate information that takes into consideration these localized differences around the world. If anyone is willing to help, please write a blog post or get in touch.

This post provided by George Kroner and the edutechnica team.

The Brewing Edtech Land Grab

I was very surprised by this wording from an edtech venture capitalist in a recent Chronicle article.

My partners and I often fantasized about an end state in which professors would be free agents and education could become “unbundled” from the traditional campus setting and offered more freely as a consumer service, or commodity, by other providers.

This quote very clearly provides a glimpse into what some VCs seem to think about higher education – characterizing it as a commodity rather than a transformational experience. Universities should be concerned about this shift in thinking, particularly as they consider how to evolve in these rapidly-changing times.

One of the most tangible ways that I see this unbundling and commoditization playing out is in the MOOC space. MOOCs are a great way for private companies (or in the case of EdX, a centrally-controlled organization) to, given time, amass the single best courses for every subject and store/deliver them through centrally-controlled platforms. The MOOC platforms are at the nexus of how I believe content and software will begin to intertwine themselves as educational technologies mature. As more people teach on the MOOC platforms, the analytics they capture and the network effects they produce will, in a self-reinforcing manner, increase the value and quality of their content and as a side effect also increase each MOOC platform’s ability to control the distribution channel of educational materials.

Many institutions have signed away their individual rights to “only a course or two” under the guise of marketing or outreach – and in doing so enable MOOCs to be the back-door to collecting all the pieces necessary for the MOOC platforms themselves to one day deliver entire programs of study – should they want to. Once the MOOC platforms reach this point and control the distribution channel – as industry after industry finds out – universities will find themselves with decreasing leverage and few options but to yield control of their academic experience to someone else. It’s almost like some variant of the tragedy of the commons except in this case the individual behavior in one’s self-interest ends up being contrary to the whole group’s long-term best interests because they are contributing to rather than depleting common resources – these common resources being courses now under the control of the MOOC providers.

Content remains king in higher ed. After all what’s a course without content? (Aside, what’s an LMS without content? What’s a MOOC platform without content?) I often complain about the high cost of textbooks, but texts are only a fraction of the total cost of higher education. Institutions charge a significant premium on top of content costs for the “complete instructional experience.”

What exactly is the value proposition that enables universities to charge so much more? Publishers are now offering courses “in a box,” and companies like ed2go (actually a part of Cengage Learning) offer pre-packaged, pre-staffed, ready-to-deliver courses that many institutions count for actual credit. Maybe the value is in an institution’s ability to validate credentials or ensure student success, but even success apparently can no longer even be defined as having completed a course. Publishers, the MOOC providers, and other course content providers are now beginning their move up the value chain into territory previously occupied only by higher education institutions. This is the next edtech land grab that I believe is coming.

So What Can Universities Do?

Recognize that new technologies provide new opportunities

Be aware of not only the threats and challenges that new technologies bring but also envision the new possibilities and opportunities that they create. (MOOCs for example, even given their current limitations, are a powerful instructional innovation.) Then protect your institution the best that you can. Use openness to defuse lock-in or exclusivity. Thoroughly review the wording of contracts for words like “perpetual,” “irrevocable,” “worldwide,” and “royalty-free” – and understand their trade-offs and implications. Decide if your institution should join organizations focused on specific concerns around course content collaboration or help build the infrastructure and software platforms to enable it.

Seek to understand the changing dynamics of educational delivery

Seek to understand how your institution’s mission, vision, and operations really support the needs of today’s learners. Should your institution change or adapt to offer new programs of study or delivery structures? The students of today may be very different from the students that you served even 10 years ago. The technologies and strategies you used 10 years ago may be very different than what you need today.

Determine how your institution will differentiate itself

When one considers that whole online programs can be outsourced, admissions processes can be outsourced, financial aid processing can be outsourced, IT helpdesks can be outsourced, teaching of entire courses can be outsourced, student success systems can be outsourced, and even transcript requests can now be outsourced – what’s left of the institution itself? In the future how will your university compete and differentiate itself? On brand name? Reputation? Research or industry partnerships? Flexibility? Affordability? Student experience? Job placement metrics? Uniqueness of programs that are difficult to replicate? Newness of programs that address leading-edge skill needs? How will universities define both value and success in a way that attracts and retains learners – and positions them for success?

Or, lacking these answers or the gumption to address change head-on, is higher education simply destined to become just another commodity?

This post written by George Kroner