Like it or not, the Learning Management System has become the primary mechanism for facilitating hybrid and online courses at higher education institutions. In our previous post, we identified that 99+% of US institutions with enrollments of greater than 2000 students use an LMS. Even for traditional face-to-face courses, the LMS plays a key role in delivering course materials, supporting online submission of assignments, storing grades, and hosting discussions. Anecdotally, it is often the second-most-visited online service used by students (with webmail being first, and registration and billing systems receiving more traffic but only during certain time periods each semester).
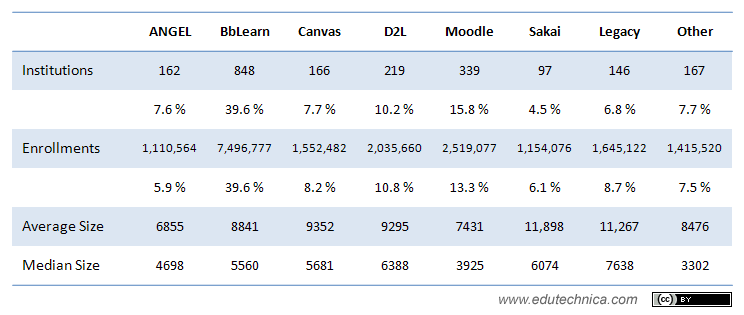
It is becoming increasingly important for institutions to make smart decisions with regards to LMS implementation. One of the goals of this project is to provide more data points on which to base LMS strategy. While our last post focused on which LMS or LMSs were in widescale use at each higher education institution, in this post we’d like to dive into more detail relating to two implementation details of the US dataset: (1) which LMS versions are in use and (2) whether the LMS is hosted or not. These two criteria directly impact how successful institutions as a whole and end-users individually can be with their LMS. As examples, decisions such as choosing to be hosted can impact whether an institution has direct access to run analytics or support queries against a production database. Similarly, upgrading to an unstable new version of an LMS can lead to user confidence and operational support challenges.
There are cascading impacts as well. LMS partners and other learning tool developers who plug into LMSs face challenges deciding which LMSs to develop for, and which versions to support. Institutions collaborating in communities of practices that focus on teaching and learning online, even when focusing on a specific type of LMS, lose effectiveness when features and tool sets differ between versions.
To provide additional clarity as to how we compile this data, let’s consider what happens when you load an institution’s LMS into a web browser. As an example, Moodle looks fundamentally different from Sakai. It runs on a different technology platform (PHP versus Java). Its HTML page structure is different. It uses different graphics, icons, CSS and JavaScript libraries. There are other differences, too, and together these form a “fingerprint” that clue us into an institution’s LMS type and version.
Each LMS also runs on a server owned by someone. In the cases of ANGEL, Blackboard, and Desire2Learn, only the vendor can host the LMS. Instructure strongly encourages its clients to host in its Amazon EC2-based environment, but because it is an open source product anyone can host it. Moodle and Sakai each have many hosting vendors from which to choose. The server on which the LMS runs is assigned an IP address issued by the American Registry for Internet Numbers which provides an API to query the owner of each address. It is with this data that we determined whether each LMS environment was hosted by the institution itself, directly by a LMS vendor, or by another third-party.
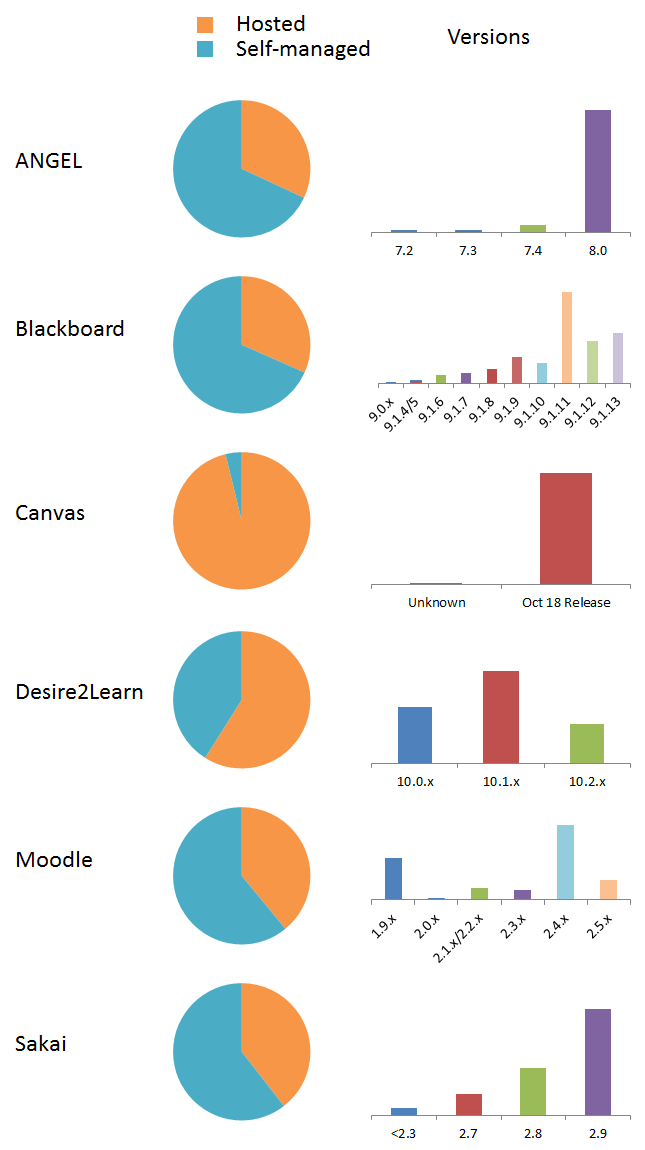
As you can see, there are some interesting differences.
Instructure’s Canvas has the least variability of all LMSs (it is also the newest entrant to the marketplace). While greater than 95% of institutions that use Canvas host with Instructure, some institutions appear to have chosen to host using their own environment. Even with this small implementation difference, greater than 99% of Canvas environments were running the latest version (as was available at the time of this posting). One institution served as an outlier, choosing to run Canvas from a virtual machine image/appliance provided by Turnkey Linux.
Institutions running Blackboard Learn have the greatest variability of major versions. Sakai has the largest breadth of commercial hosting providers including (formerly) rSmart, LongSight, UNICON, and ETudes. The largest single hosting provider for Moodle is Moodlerooms (now owned by Blackboard). Desire2Learn hosts the largest percentage of environments of any proprietary (ie: non-open-source) LMS. We’ll let you draw other conclusions for yourselves from the graphics provided above.