When we provided our initial analysis of LMS usage in fall of 2013, one point of feedback that we heard loud and clear is that because our data only included institutions with greater than 2000 enrollments, we excluded a fair number of community colleges, career colleges, and liberal arts colleges. To the credit of those who provided this feedback, they were absolutely correct. Three-quarters of all recognized higher education institutions in the United States have fewer than 2500 FTE – a critical demographic as the majority of universities in the US are of this size or smaller. To more fairly represent LMS usage we needed to include data on smaller schools.
We are now excited to be able to provide analysis of a data set for institutions with greater than 1000 students. This increases our overall coverage to almost 2900 institutions. In addition to our previous statements about data quality, we additionally believe this data set to be greater than 95% accurate for all universities between 1000 and 2000 FTE.
For this analysis, we’ve broken out a separate category for “no detected institutional LMS” and combined what previously were the “legacy” and “other” categories into just one – “other.” We define “no detected institutional LMS” as lack of a central system with online classroom capabilities. Schools that have a portal but not an LMS fit into this category as do schools such as vocational technical schools, trade schools, schools that teach driving, auto mechanic schools, beauty schools, some medical technologist schools, some dental hygienist schools, schools that focus on the performing arts, culinary schools, and other schools that rely heavily on face-to-face or hands-on delivery of educational experiences. For this data set, a higher percentage of manual verification was performed to ensure its validity.
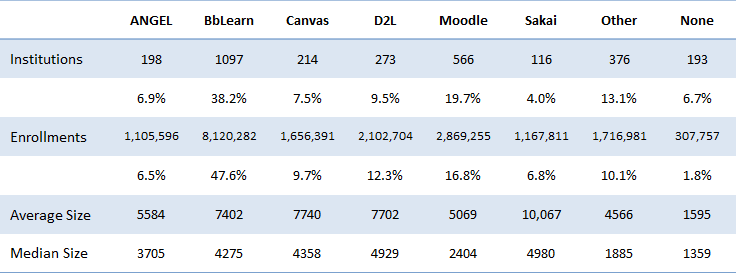
Comparing this data to our previous post, there are some interesting differences to notice. The first thing we noticed was the increasing diversity of LMSs in the 1000-2000 FTE range. The LMS capability of Jenzabar had a strong showing as did eCollege, LearningStudio, OpenClass, WebStudy, ed2go, Epsilen, CampusCruiser, Edvance360, BrainHoney, and several other small-scale and homegrown LMS-like solutions. Together, these reflected roughly one-fifth of all LMSs in this segment (in comparison, they reflect less than 10% of schools with greater than 2000 FTE).
Nevertheless, the major LMSs still maintained dominance. The average and median sizes now begin to show material differences. Overall market share dips slightly for each LMS except for Moodle which increases significantly and for institutions choosing “other” LMSs.
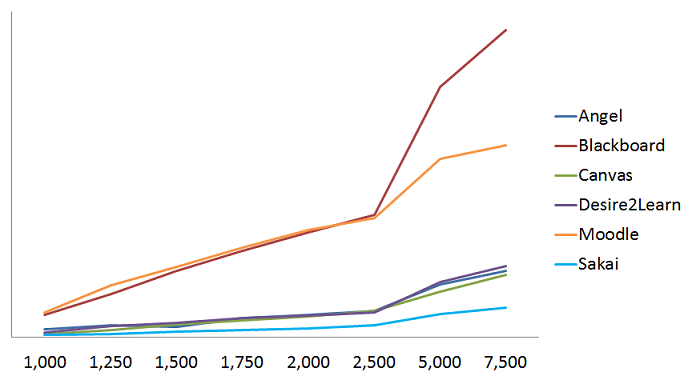
Seeing Moodle’s increased usage prompted us to investigate Moodle further. An interesting thing happens below 2500 FTE; Moodle actually exceeds Blackboard’s market share. Only after this point do the demographic segments diverge.
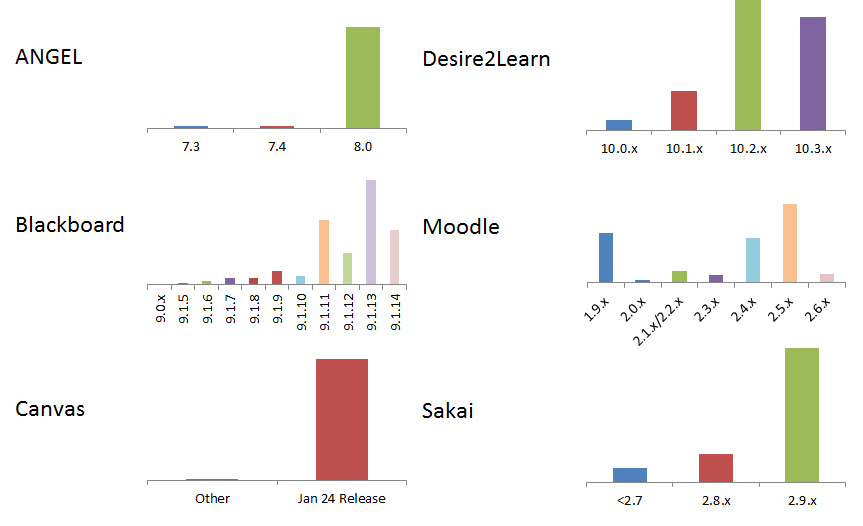
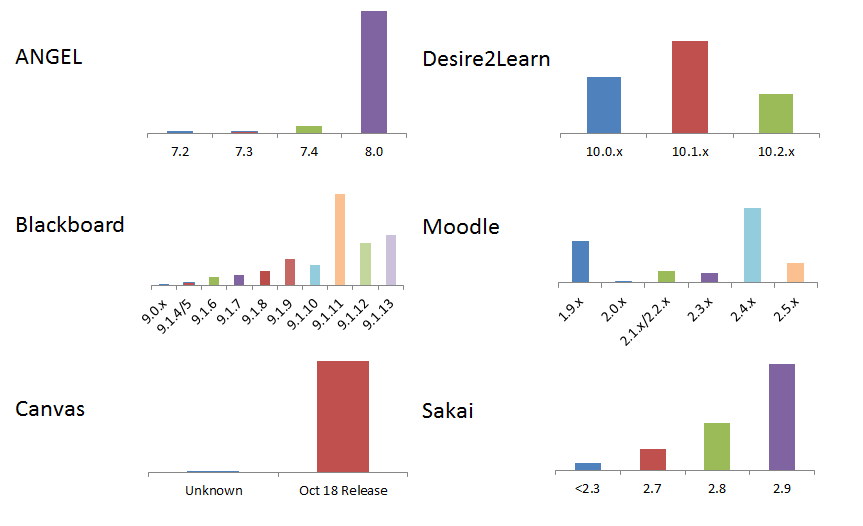
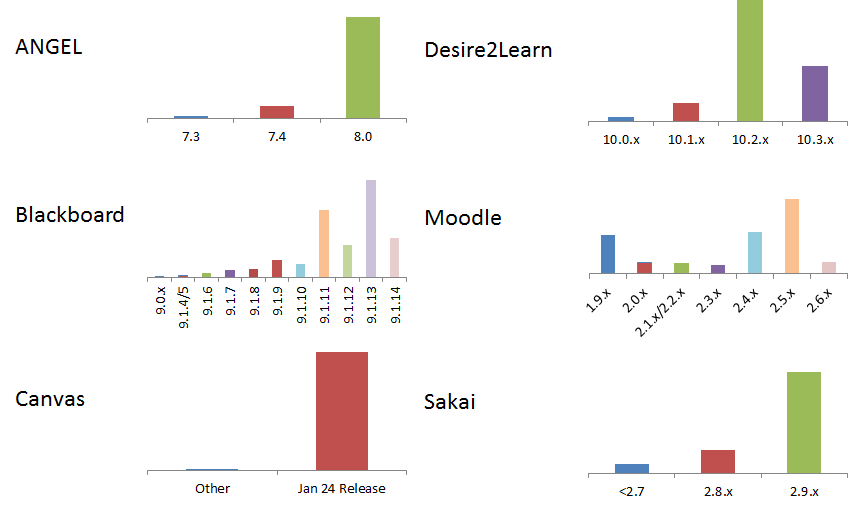
When factoring smaller colleges into our Winter 2014 update we discover that still other demographics change in interesting ways. A higher percentage of smaller institutions running Blackboard Learn run its latest version. A lower percentage of smaller institutions run the latest version of Desire2Learn (preferring to stay back one major release). And a slightly higher percentage of smaller institutions also prefer the next-to-latest release of Moodle.
With additional, new data in hand we intend to keep the community informed of the interesting patterns and trends that we continue to learn about as we collect and update this data moving forward.
