For the fourth time, we are excited to provide data relating to the use of Learning Management Systems in the US, Australia, Canada, and the United Kingdom. Since this project began, we are humbled by its mentions in industry publications, citations in academic journals, highlights in conference keynotes, and in particular – because of our original mission to inform technology selection practices at higher education institutions – the many references in LMS review and decision-making materials that we’ve come across.
Each Fall provides an opportune moment to update our findings because this is typically when higher education institutions have implemented any LMS changes for the new school year. As a reminder, the primary focus of our work is US higher education institutions, as listed in the Department of Education’s IPEDS data source, with more than 500 students. This year, our goal was to refine this data set to better reflect which LMSs these institutions are actively using. For this reason, we have removed LMSs that appear to be evaluation or demonstration sites (or otherwise not in active use; we do, however, continue to include pilot LMSs being actively used by students and instructors). Where there has been uncertainty, we have relied on social media, listserv postings, press releases, student newspapers, IT support and help desk articles, faculty senate minutes, RFP documentation, and other publicly-accessible, verifiable records to validate and confirm this data. In addition, we have removed the growing number of colleges and universities that have closed their doors since this project began. This has disproportionately impacted smaller and for-profit institutions. The goal remains to count those LMSs in broad use by each active institution, and this year we also exclude “zombie LMSs” where the LMS lives on even though the institution does not. Here are our findings.
 Overall
US higher educational institutions continue to consolidate onto 4 primary LMSs: Blackboard Learn, Instructure Canvas, Moodle, and D2L Brightspace. Vendor hosting and cloud-based/SaaS solutions are becoming more common, and as a result more institutions are running LMS software that is more up-to-date. Though many schools still run more than one LMS, fewer schools are choosing to run more than one LMS following an LMS migration effort. Finally, schools are increasingly migrating more quickly off of LMSs that have an approaching end-of-life (EOL).
ANGEL
- ANGEL, acquired by Blackboard in 2009, was originally scheduled to be EOL’d in 2014, then supported indefinitely, and finally slated for end of support in October of this year.
- Institutions have responded in a timely manner to the revised end-of-life for the ANGEL LMS. The number of institutions using it continues a rapid decline, and the majority of remaining ANGEL institutions have a replacement LMS running in co-production as their migrations continue.
Blackboard Learn
- There is evidence that the Blackboard Learn client base is showing signs of stabilization. The number of Blackboard Learn institutions that are running a second, competing LMS in addition to Learn is the lowest that it has been in some time.
- While the majority of the earlier ANGEL converts have switched to Instructure Canvas, Blackboard has done an effective job at converting its lagging ANGEL holdouts to Learn.
- While there are many promising indicators, the number of Blackboard Learn institutions running unsupported versions (defined as those running versions of April 2014 and older) grew slightly this year to 12.6% of the total installed base.
Blackboard Learn SaaS
While our initial report indicated additional installations of Learn SaaS, we admittedly misunderstood the official definition of “Learn SaaS.” After clarification from Blackboard and cross-referencing this documentation, we now believe that we’ve detected Learn SaaS being used in a production configuration by 7 institutions. In addition, we have observed encouraging improvements that indicate Blackboard has moved towards a continuous delivery model of Learn releases that allow the organization to align its on-premise, hosted, and SaaS product lines. We also learned that there were efforts to create an Ultra theme for Learn 9.1 installations. While certain artifacts of what was supposed to be Ultra do appear to have shipped in legacy versions, only Learn SaaS officially supports the true, new Ultra user interface. (Updated 10/10/2016)
Instructure Canvas
- Instructure Canvas continues its steady growth pattern, with 55 more institutions switching since the end of last school year.
- Despite continuing growth, we have removed over 50 Canvas environments from the data set since our Spring update. Those removed were determined to be evaluation or sales demo sites and not true pilot or production installations. In addition, we removed sites for institutions that chose not to proceed with Canvas during a LMS selection process or pilot.
- While Canvas continues to be an extremely popular choice, LMS re-evaluations are increasingly competitive, and Instructure has not been winning them all.
D2L Brightspace
- D2L’s Brightspace received moderate growth year over year adding 41 new institutions since the end of last school year, including becoming the replacement LMS for Kaplan.
- D2L continues to make significant progress towards reducing the spread of Brightspace versions in use by moving their client base onto their Continuous Delivery model that receives automatic monthly updates to the latest version.
Moodle
- Moodle continues to be the second most popular LMS by number of institutions and remains very popular among smaller colleges.
- Over 1/3 of Moodle institutions have already upgraded to version 3.0 or 3.1 released late last year and earlier this. While the number of schools running very old versions of Moodle continues to decrease, paradoxically Moodle now has the largest percentage of total installed base of any LMS running unsupported versions (with 13% running version 2.6 or older). This means that Moodle has now passed Blackboard Learn as having the highest percentage of total institutions running unsupported, older versions.
- A Moodle vendor from Baltimore, Maryland has been dominating new Moodle installations. The big surprise though is that it is not Blackboard’s Moodlerooms. Rather, eThink Education, a new Moodle partner – also from Baltimore – appears to be achieving much success, in several cases winning Moodlerooms customers away from Blackboard.
Pearson
- Following Pearson’s announcement of its exit from the LMS space, institutions have been quickly and responsibly migrating to other LMS solutions. D2L and Canvas are the 2 most popular LMSs to which Pearson schools are migrating.
- Pearson continues to be disproportionately impacted by university closures, in particular by for-profit universities discontinuing operations.
Sakai
- While Sakai continues to improve as a product, and the remaining Sakai institutions are adopting newer versions of this LMS more quickly than in previous years, Sakai continues to experience a continued weakening of its overall installed base.
Other
- Most new growth in the “other” category has come from Schoology who has added around a dozen new higher education customers in our data set. Note that to be considered in this data set, the LMS has to be used either as an institution-wide or department-wide solution. LMSs used by individual instructors or for individual courses are not included.
- 9 institutions are now using Google Classroom at scale.
- Of all “other” types of LMSs, “custom” remains the most popular, particularly among larger for-profit institutions. However, fewer larger schools are choosing custom LMSs in whole or in part.
- The most popular “other” LMS for smaller schools is Jenzabar’s bundled eLearning LMS.
- For smaller schools, “custom” LMSs are usually cobbled together using SharePoint or another content management system.
None
- Schools using no LMS typically still have an online portal for class registration and tuition payment – but not a true LMS. As in previous years, schools using no LMS tend to focus on vocational/technical skills, culinary training, performing arts, cosmetology, truck driving, or other hands-on professional training.
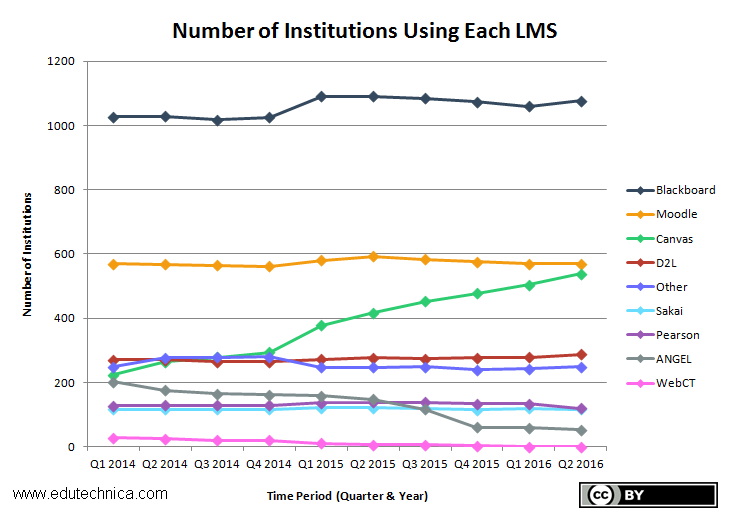
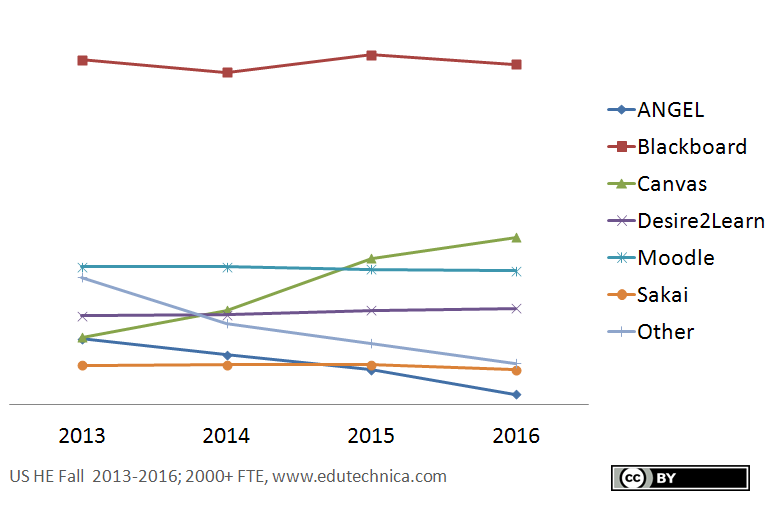
Comparison to previous years
To make a valid comparison to our earliest data, we consider only those schools with more than 2000 students. When doing so we see that Canvas is growing significantly, D2L is growing slightly, Moodle and Sakai are shrinking slightly, and the usage of ANGEL and Other LMSs (in this graphic including Pearson) is shrinking moderately. Finally, while Blackboard has experienced a dip in usage for schools with more than 2000 students, they have added to their installed base when including all schools down to 500+ students suggesting a higher proportion of their growth coming from institutions having 500-2000 students. This makes sense, as many lagging ANGEL institutions are of this size and over the past year have migrated to Blackboard Learn.
International LMS usage
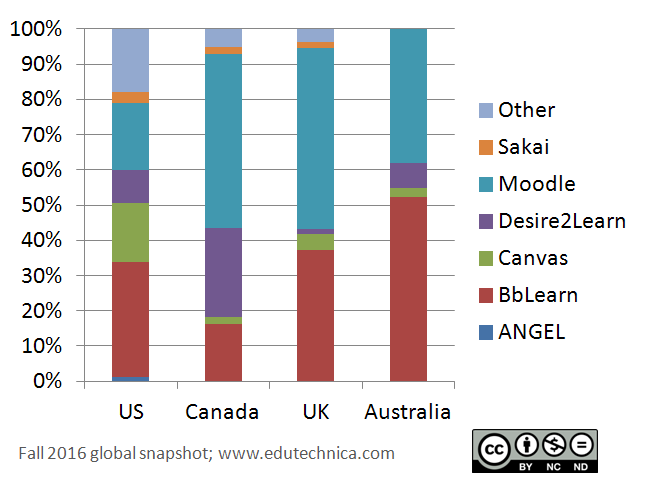
While much of our research focuses on US higher education, this year has also seen some LMS shifts on a global scale. For this analysis, we have used this list of “Australian Universities” from the Australian Government Tertiary Education Quality and Standards Agency, this list of universities from Canada’s Department for Employment and Social Development, and this list of institutions designated as universities by the UK Department for Education to perform analysis similar to that undertaken in the United States.
What we found is that Moodle remains the most popular LMS in Canada and the UK but strangely not in Australia where it was invented. D2L Brightspace continues to be the most popular commercial LMS in Canada (where the company is based) with Canvas receiving only limited traction. While Canvas has had its most success growing a small cohort of universities in the UK, the company continues to experience higher education growth challenges outside of the US in these countries. Finally, Sakai has all but disappeared from Australia as an institutional LMS over the past year although it is still used by some institutions for research collaboration or other non-LMS uses.