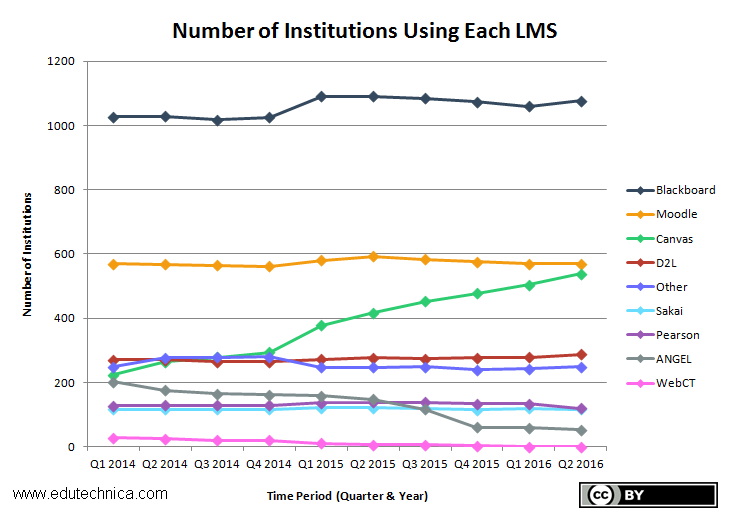
Earlier this summer, Client Stat produced specific analysis relating to changes in LMS usage for US higher education institutions with more than 1000 students as they took place quarter-by-quarter since 2014. As with all of our previous efforts, this analysis is not based on survey data or sampling but comes from a complete data set generated using an automated process coupled with human validation and verification. Client Stat would now like to share some of the more interesting findings from this presentation.
As students head back to school this fall, more will experience a new online classroom experience than possibly ever before. Schools are not only switching LMS products at a greater pace than in recent years but have also been busy upgrading to more current versions of their existing LMS software – often providing a significantly different UI/UX than existed even at the end of the last school year. Compared to just 139 schools in 2014, 283 today are running multiple LMSs, a behavior strongly correlated with an ongoing migration effort. Schools that have previously migrated are also retiring legacy LMSs at a quicker pace, typically well within 1 year after standing up the new LMS. Schools that switch LMSs are increasingly less likely to run multiple LMSs after a migration or LMS centralization project is complete. Legacy LMSs including WebCT, ANGEL, and now Pearson’s have either entered a steady decline or have been completely phased out. Canvas continues to outpace every other LMS in terms of new installations.
We also took a detailed look into which institutions were switching between which LMSs. As you can interpret from the chart below, the largest raw number of LMS switches during this time period were caused by ANGEL institutions switching to Blackboard, the 2nd largest were institutions switching from Blackboard to Canvas, and the third largest were ANGEL to Canvas. No “Other” LMS seemed to gain significant traction during this time period. Rather, there is an increasing consolidation of institutions onto Blackboard, Moodle, Canvas, and D2L.

Some of our analysis related to version and hosting characteristics which also revealed interesting patterns and trends.
Version Trends
- Due primarily to their hosting model, Instructure is by far the best at keeping institutions in lock-step on the latest version of their LMS, Canvas. Only self-hosted Canvas installations seemed to lag.
- D2L has made the most progress in terms of upgrading institutions to the latest major LMS version (13% of total Brightspace installations in 2014 compared to 62% in 2016 were running the most current major version)
- Blackboard Learn institutions exhibit the most variation of version in use (with 13 different major versions currently in production use)
Hosting Trends
- Across all types of LMSs, 91% of institutions that host with an LMS vendor remain customers of that LMS 3 years later. Included in this statistic are case scenarios where Moodle and Sakai institutions switch hosting/support vendors but not LMSs.
- Of non-SaaS LMSs (i.e.: excluding Canvas and Pearson Learning Studio), Blackboard Learn institutions host with their LMS vendor most often (55%)
- Blackboard Learn has had the greatest increase in the number of hosted LMSs over the past 3 years (250+ new hosted installations since 2014 driven primarily by conversion from self-hosting and ANGEL migrations)
- Moodle institutions are most likely to self-host (64%)
Mapping it Out
Visualizing this change is easy to do in numbers and line graphs. Below, you can observe this quarter-by-quarter change geographically on a map. Again, this data only represents those schools having more than 1000 students. Black is Blackboard. Orange is Moodle. Green is Canvas. Red is Brightspace. You will see that pink (WebCT) and gray (ANGEL) installations largely disappear as time moves forward. Sakai (light blue), Other (darker blue), and Pearson (purple) remain less concentrated. Canvas picks up market share in many locations but is particularly pronounced in the Pacific northwest, Midwest, and Southeast. Moodle usage concentrates in North Carolina where the state higher education system largely decided to migrate to this LMS.
In the coming month we look forward to providing our typical yearly update that includes current data for Fall (teaser: there are some very interesting developments indeed).
– Stephanie, Lead Data Scientist