Institutions are continuing to shift between LMSs at a steady pace, and considering that Blackboard has now shipped Learn SaaS/Ultra, ANGEL will reach its end-of-life in October, and Pearson has decided to exit the LMS space, we expect this trend to continue through this year.
To visualize the change over the past several years, let us consider the 3 LMSs with the biggest shifts: ANGEL, Blackboard Learn, and Canvas. Hover over this image to see the trend. (For fun, also compare the maps below to the ones in this post showing many of the WebCT LMSs in use in 2010.) While change always seems so painfully slow, it is clear that institutions are continuing to make big changes.
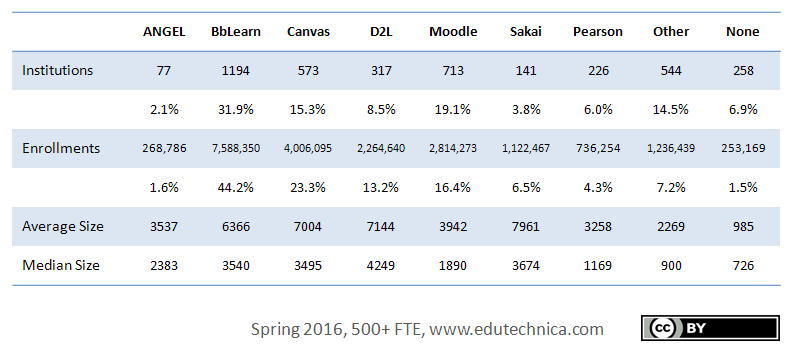
For the first time, we are publishing numbers for all schools with greater than 500 FTE students and breaking Pearson out as a separate LMS. When institutions start migrating to Blackboard Learn Ultra, we intend to also break it out as well. Considering the additional schools added in this report compared to our last report, we see that Canvas (by student enrollments) has taken a commanding second place position to Blackboard Learn while Moodle remains in a solid second (by institutions). Blackboard’s share by institution, however, drops to only 31.9% even though it still has almost double the share by enrollments of its nearest competitor. Because of the recent shift in Blackboard’s partnership with Moodle, we also wanted to note that 22.9% of Moodle institutions listed in this data set are currently known to host with Moodlerooms.
ANGEL institutions continue to migrate to alternate solutions, though 37 institutions still do not yet appear to be piloting or to have chosen a replacement LMS. For what it is worth, ANGEL institutions are migrating to other LMSs much more quickly than WebCT institutions did when faced with an end-of-life decision. This may be because LMS migration costs have decreased, and it is easier to do so now compared to 5 years ago.
Finally, Canvas’s numbers reflect not only net-new institutions and active pilots but also the removal of institutions who piloted Canvas and ultimately chose not to implement it. It is still the case that the majority of institutions that do pilot Canvas end up switching to it. Their growth continues to be in-line with recent trends.