It has been one year since the edutechnica team has been tracking and trending global LMS usage. Over the past year we’ve been quite busy refining our methodology and ensuring quality of this data. Without further ado, we present to you our 2014 LMS usage data ahead of the 2014 EDUCAUSE annual conference.
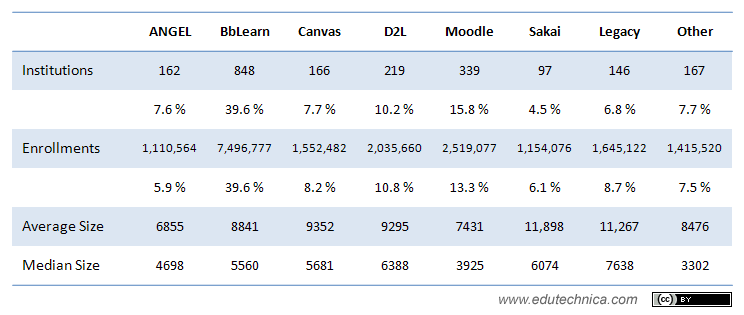
To begin, let’s review the 2013 data set encompassing all US higher education institutions with greater than 2000 FTE.
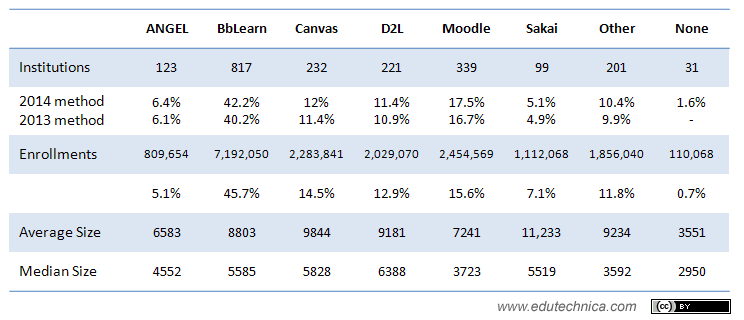
For 2014, here is that same set of data for all US higher education institutions, again with greater than 2000 FTE. You’ll notice some differences in the next graphic below. Some schools during the past year have chosen to use multiple LMSs. Others have consolidated onto one. Some have merely switched flavors. Still others have chosen to move from having no LMS to one LMS. A lagging minority have finally migrated from what we termed in 2013 a “legacy” LMS to a modern one. Our data, again, reflects active LMSs in use by a given institution, excepting those that are clearly used for only a specific course or by a specific instructor. When an LMS is used by the “distance education program” or by an entire college, we include it in these calculations.
This year, we also break out institutions who do not use an LMS separately (these, again, tend to be performing arts schools, beauty and massage therapy schools, trade schools, automotive repair schools, driving schools, and others that offer programs of study with significant face-to-face or hands-on components).
In 2013, the denominator of our market share calculation was the total number of LMSs in use. We have changed the denominator of our calculations in 2014 to be the number of institutions with greater than n FTE to reflect a more accurate calculation of market share. To do a direct year-over-year comparison from the 2013 data, it is best to view the row labeled “2013 method” in the graphic below; however, we will use the “2014 method” moving forward for a more accurate measurement.
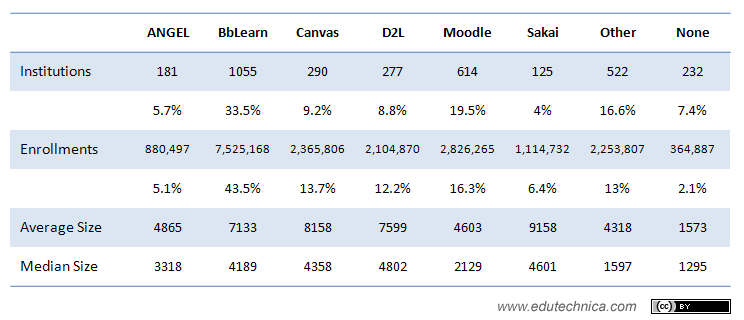
During 2014 we became better at collecting data for smaller institutions. In February, we released analysis for US institutions with greater than 1000 FTE. Today, we provide the same data for all institutions with greater than 800 FTE.
As you can see, the data that encompasses smaller institutions tells a very different and more complete story that reflects a truer representation of LMS usage. The most notable differences here are that when including smaller institutions, market share of Blackboard Learn by number of institutions drops significantly while Moodle and “Other”gain significantly. In 2014, it still holds true that smaller institutions are more likely to use a non-traditional LMS or Moodle.
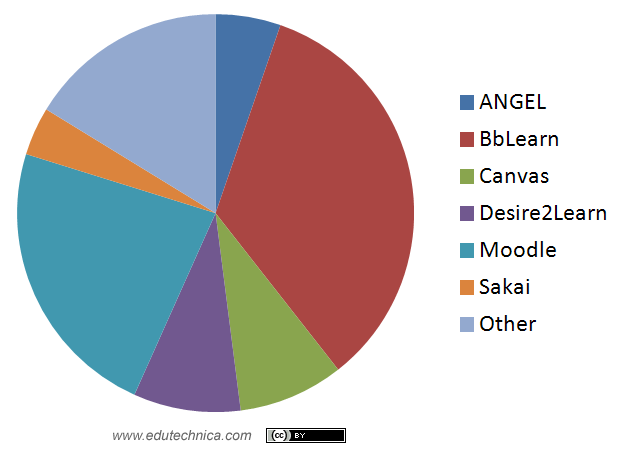
In addition to our analysis of US higher education, we again analyzed LMS usage in Australia, Canada, and the UK for a more global perspective. For our 2014 analysis, we used the same set of institutions that we used in 2013 to keep this data uniform. Combined with the US data, you can see how total global LMS usage in these four countries compared from 2013 to 2014 in the two graphics below. Moodle, Canvas, and “Other” take a larger piece of the pie. ANGEL and Blackboard Learn shrink in comparison. Desire2Learn and Sakai remain relatively constant.
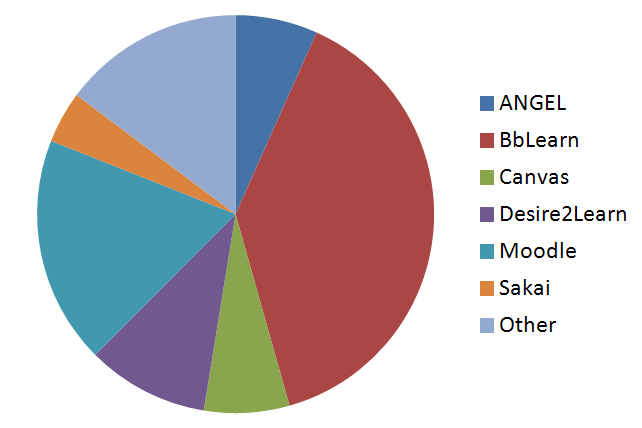
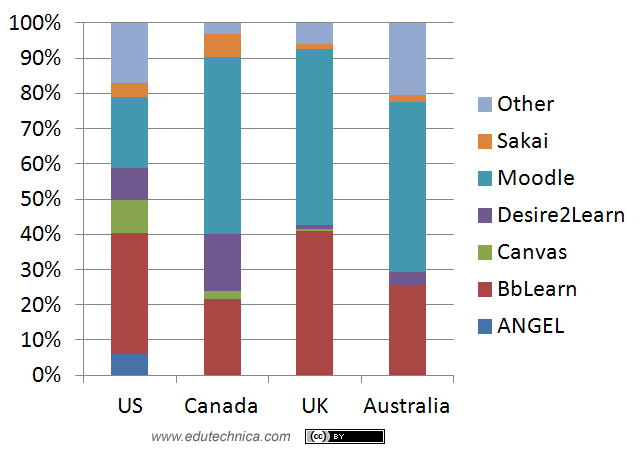
As for global LMS usage, we also offer the same 2013/2014 comparison of LMS usage by country as percentage of total in the two graphics below.

In 2014, ANGEL usage shrinks in all countries, and Moodle usage grows in all countries. Blackboard Learn has shrunk the most in the UK. Canvas has not taken off overseas in the same way that it has in the US. Usage of Other LMSs has grown in the US and in Australia but has shrunk in Canada and the UK.
Addendum
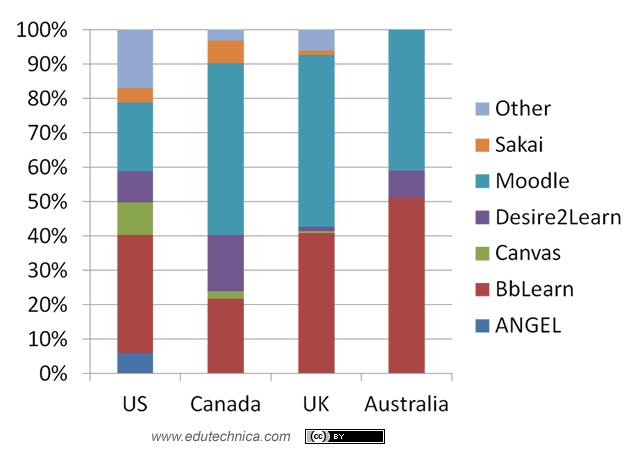
Allan Christie, currently the General Manager of Blackboard Australia and New Zealand, points out on his blog some helpful information to better understand the Australian higher education market. In summary, Australia “generally accepts” that there are only 39 big U universities while there are 176 “registered higher education providers.” When considering only the universities, the above global LMS usage chart would look like the one below. This modification puts Blackboard Learn squarely in the lead in Australia and at the highest percentage market share of any other country presented.
Similarly, our UK data includes many more institutions than are categorized as universities by the Universities UK organization including Colleges of higher education and Further Education colleges. We assume the same may be true in Canada. In the US, however, we use the US Department of Education’s Integrated Post-secondary Education Data System as our source of truth for a complete list of institutions.
We would like to know more about how to better provide accurate information that takes into consideration these localized differences around the world. If anyone is willing to help, please write a blog post or get in touch.
This post provided by George Kroner and the edutechnica team.